Aristo ScholarsGetting in

Admissions Essentials · Getting in

Who attends each California college

Undergraduates at every UC, Cal State and private four-year college in California by race and ethnicity and Pell Grant share, fall 2024, with how the most selective colleges compare.

SourceUS Department of Education, release of October 15, 2026: enrollment for fall 2024, Pell Grants for 2024-25; Opportunity Insights, students born 1980 to 1982, published 2017.

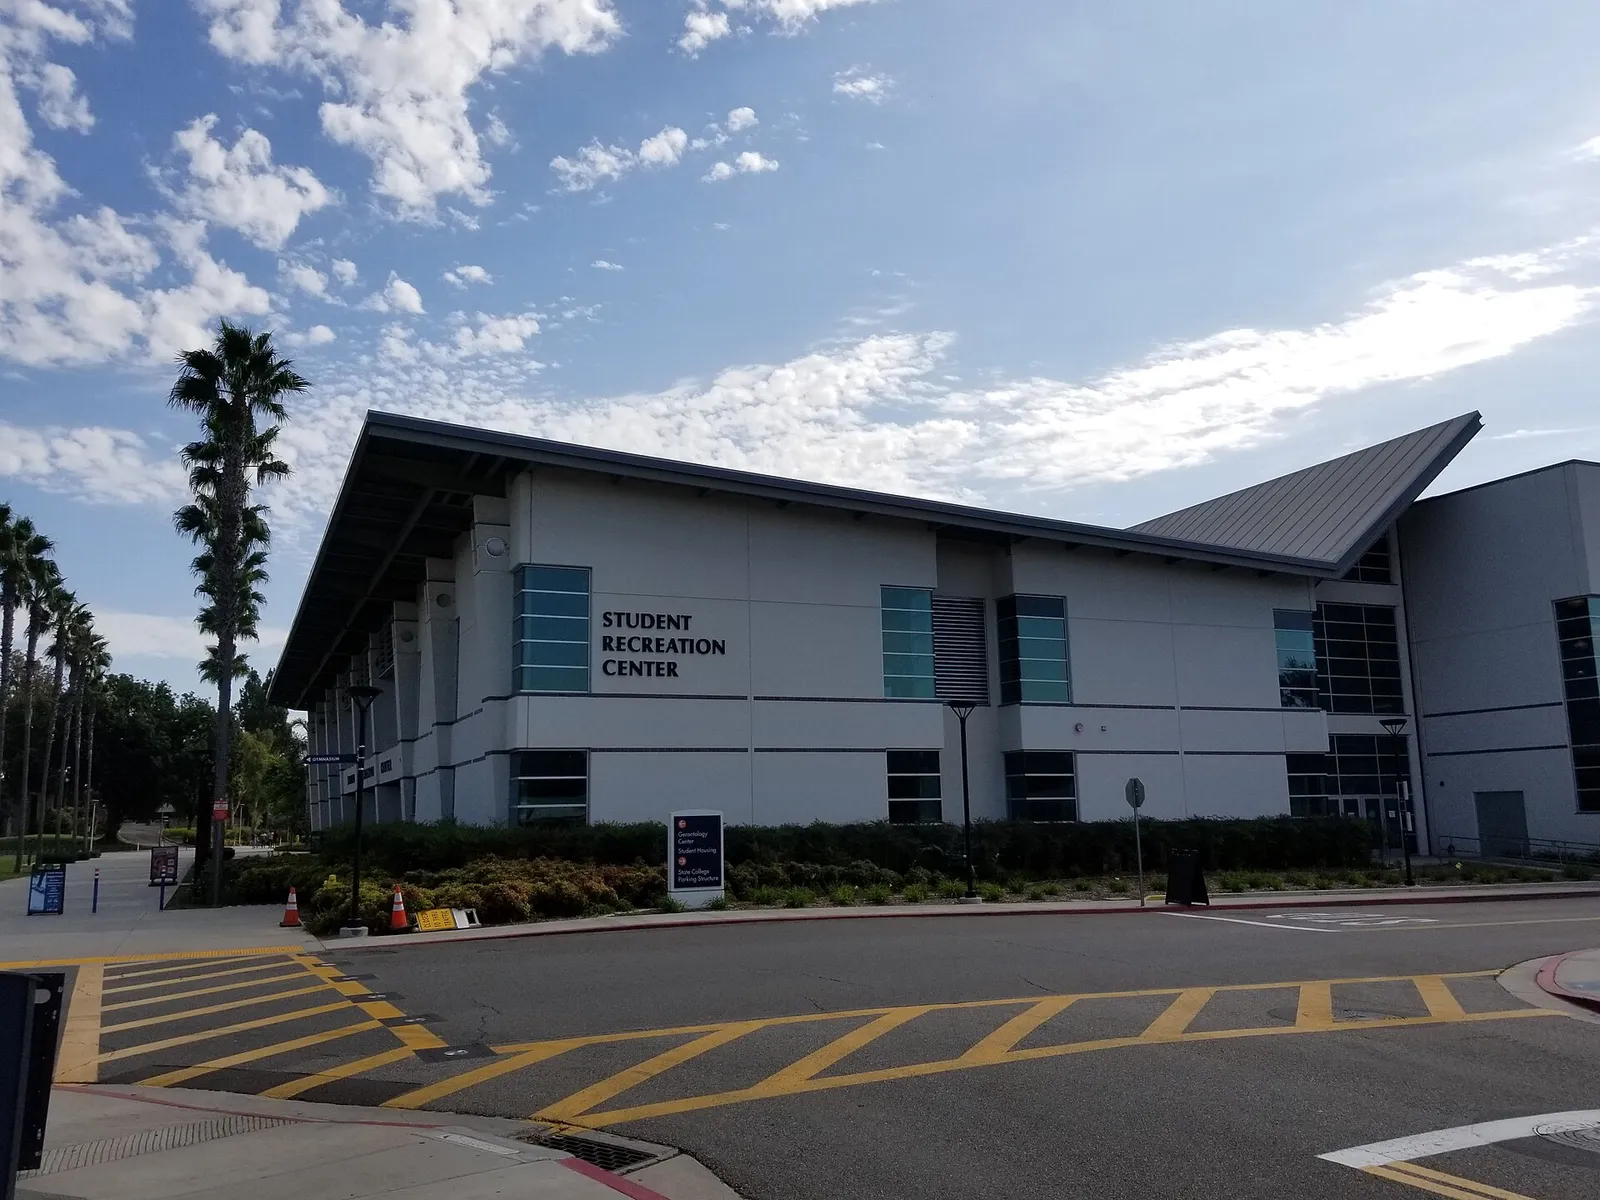
The Student Recreation Center at Cal State Fullerton, a white building with a sloped roof beside palm trees
Photo: Spatms, CC BY-SA 4.0, via Wikimedia Commons

California’s four-year colleges, by who is in the room

In fall 2024, 797,020 undergraduates were working toward a degree at the 115 public and private nonprofit four-year colleges here. 39.2% were Hispanic or Latino, 22.1% white, 20.2% Asian and 4.2% Black.

The 10 colleges that admit fewer than one applicant in four hold 12.6% of those undergraduates but only 6.9% of the Hispanic ones. Pell Grants, which go to students from lower-income families, reach 51% of undergraduates across the Cal State campuses, 37% across the UCs and 31% across the private colleges.

One college at a time

Undergraduates, fall 2024
33,068
With a Pell Grant, 2024-25
32%
Admit rate, fall 2024
11%

UC Berkeley undergraduates by race and ethnicity

0%20%40%60%80%100%Hispanic or Latino22.1%Asian35.4%White19.8%Black2.1%Two or more races6.8%International9.8%American Indian or Alaska Native0.1%Native Hawaiian or Pacific Island…0.1%Unknown3.8%

Shares of degree-seeking undergraduates as the college reported them to the federal IPEDS survey. International students are counted on their own, not by race.

UC Berkeley students’ parents, by US income fifth

0%20%40%60%80%100%Bottom fifth8.8%Second fifth10.6%Middle fifth12.9%Fourth fifth16.3%Top fifth51.3%

Opportunity Insights, students born 1980 to 1982, about 4,624 students a year. 4.7% had parents in the top 1%. This is the newest public release and it is two decades old, so read it as history, not as today’s class.

Every college on one measure

0%25%50%75%100%UCCal StatePrivateUC BerkeleyUCLAUC DavisUC San DiegoUC IrvineUC Santa BarbaraUC Santa CruzUC RiversideUC MercedCal Poly Maritime AcademyCal Poly San Luis ObispoCal Poly HumboldtSan Jose StateSan Diego StateCal State SacramentoCal State ChicoSan Francisco StateCal State East BaySonoma StateCal State San MarcosCal State Long BeachCal Poly PomonaCal State Monterey BayCal State FullertonCal State NorthridgeCal State Channel IslandsCal State StanislausCal State FresnoCal State BakersfieldCal State Dominguez HillsCal State San BernardinoCal State Los AngelesYeshiva Ohr Elchonon Chabad West Coast Talmudical SeminaryCalifornia Prestige UniversityHaven UniversityMinerva UniversitySan Francisco Bay UniversityNortheastern University OaklandLincoln UniversityPalo Alto UniversityAntioch University-Los AngelesSan Francisco Conservatory of MusicTouro University WorldwideArt Center College of DesignUniversity of the WestScripps CollegePitzer CollegeSoka University of AmericaClaremont McKenna CollegeGolden Gate UniversityCalifornia College of the ArtsSouthern California Institute of ArchitectureStanfordCalifornia Institute of the ArtsPomona CollegeCaltechOccidental CollegeCharles R Drew University of Medicine and ScienceCalifornia Institute of Integral StudiesSUM Bible College and Theological SeminaryShasta Bible College and Graduate SchoolPepperdine UniversityThomas Aquinas CollegeSanta Clara UniversityChapman UniversityUSCThe Master's University and SeminaryThe Chicago School at Los AngelesEpic Bible College & Graduate SchoolSouthern California SeminaryHarvey Mudd CollegeUniversity of San FranciscoWestmont CollegeOtis College of Art and DesignLaguna College of Art and DesignBiola UniversityLoyola Marymount UniversityWilliam Jessup UniversitySan Diego Christian CollegeGrace Mission UniversityPoint Loma Nazarene UniversityWoodbury UniversitySamuel Merritt UniversityUniversity of San DiegoBethesda UniversityUniversity of the PacificHope International UniversitySimpson UniversityConcordia University-IrvineAntioch University-Santa BarbaraMenlo CollegeDominican University of CaliforniaNational UniversitySaint Mary's College of CaliforniaJohn Paul the Great Catholic UniversityWorld Mission UniversityWhittier CollegeAzusa Pacific UniversityCalifornia Lutheran UniversityHumphreys UniversityCalifornia Baptist UniversityLife Pacific UniversityUniversity of RedlandsVanguard University of Southern CaliforniaLoma Linda UniversityNotre Dame de Namur UniversityPacific Oaks CollegeMiddlebury Institute of International Studies at MontereyThe Chicago School at San DiegoLa Sierra UniversityMount Saint Mary's UniversityOak Valley CollegeFresno Pacific UniversityUniversity of La Verne

Each dot is a California four-year college; tap one to open it above. Race, ethnicity and Pell shares are for fall 2024 and 2024-25. The two parent-income measures are Opportunity Insights’ figures for students born 1980 to 1982 and cover only the 70 colleges they could match.

The most selective colleges

CollegeAdmit rateHispanicBlackPell GrantUndergraduates
Caltech2.6%17.4%4.7%22.8%987
Minerva University3.0%0.3%0.0%0.0%637
Stanford3.6%17.1%7.4%21.9%7,554
Pomona College7.1%17.2%9.2%22.8%1,666
UCLA9.0%24.2%3.4%31.9%33,475
Claremont McKenna College9.6%14.8%4.1%18.3%1,388
USC9.8%20.0%7.1%26.6%20,443
UC Berkeley11.0%22.1%2.1%31.9%33,068
Harvey Mudd College12.7%22.0%5.2%20.0%921
Northeastern University Oakland16.7%6.5%6.9%28.0%464
All 115 colleges39.2%4.2%797,020

Admit rate and enrollment are for fall 2024, Pell Grant share for 2024-25, all from College Scorecard’s October 15, 2026 release. Shares count degree-seeking undergraduates; international students are counted on their own.

What these numbers cover

The colleges are every California public and private nonprofit college that grants mostly bachelor’s degrees, is operating and is not online-only. Community colleges and for-profit colleges are not included. Each college reports its own students’ race and ethnicity to the federal IPEDS survey from what students say about themselves.

The parent-income figures come from Opportunity Insights, a research group at Harvard, which linked college records to tax returns for students born 1980 to 1982. Its college-by-college table of parents’ incomes has not been updated since, so a college’s figure describes its students of about twenty years ago.

Where every number comes from

We downloaded these files ourselves and computed every figure on this page from them. Where a publisher left a value blank for privacy, we left it blank too.
The odds for everyone, and yours

The numbers tell you the odds for everyone. A counselor tells you yours. Talk to one of ours, free.